
System Monitor Tracing for Active Recording
Issue
Active Recording is failing to capture recordings. Use this article if you encounter ANY of the following:
- All steps in this article have failed to resolve the issue.
- The following entry appears in Tomcat logs:
DEVLINK3_CONNECT_FAILED- Tomcat logs are generally located at:
C:\Program Files\Avaya Call Reporting\tomcat\logs/var/lib/avaya_call_reporting/tomcat/logs
- Tomcat logs are generally located at:
- Premature
BYEevents in the Recording Library logs.- Recording Library logs are generally located at:
C:\Program Files\Avaya Call Reporting\recording library\logs/var/lib/avaya_call_reporting/recording library/logs
- Recording Library logs are generally located at:
- Other anomalies that suggest there may be a deeper cause for ACR issues.
Question
How can System Monitor trace filters be used to help gather more information about the IP Office to ACR connection?
Answer
Using the correct filters, we can generate a Monitor Trace with an output log file for review.
Steps
-
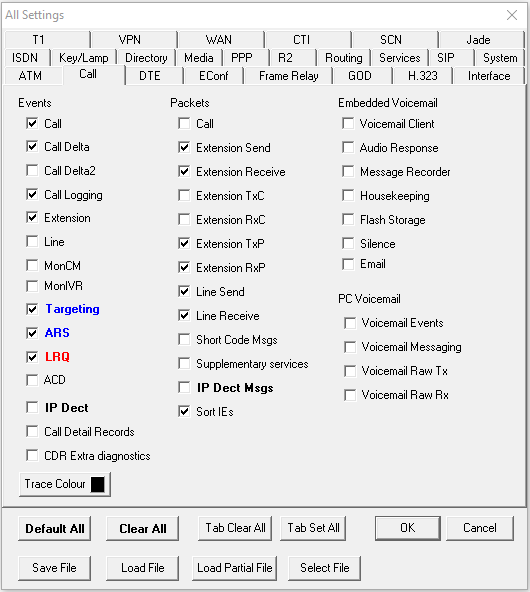
Enable the following filters in System Monitor > Filters > Trace Options to provide accurate logs on the IPO connection:
-
Call tab:
-
Call
-
Call Delta
-
Call Logging
-
Extension
-
Targeting
-
ARS
-
LRQ
-
Extension Send
-
Extension Receive
-
Extension TxP
-
Extension RxP
-
Line Send
-
Line Receive
-
Sort IEs
-
-
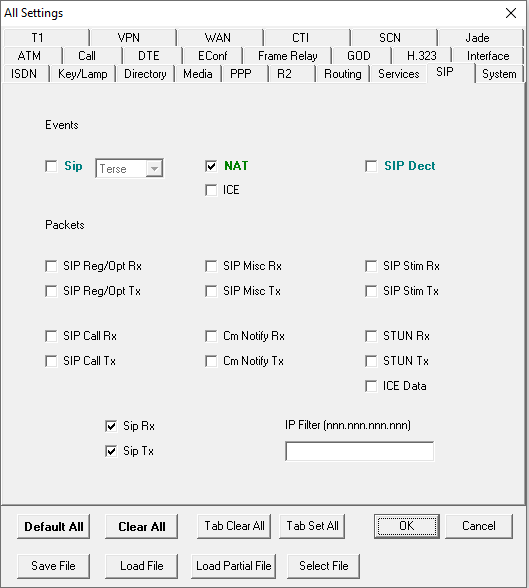
Sip tab:
-
Sip Rx
-
Sip Tx
-
-
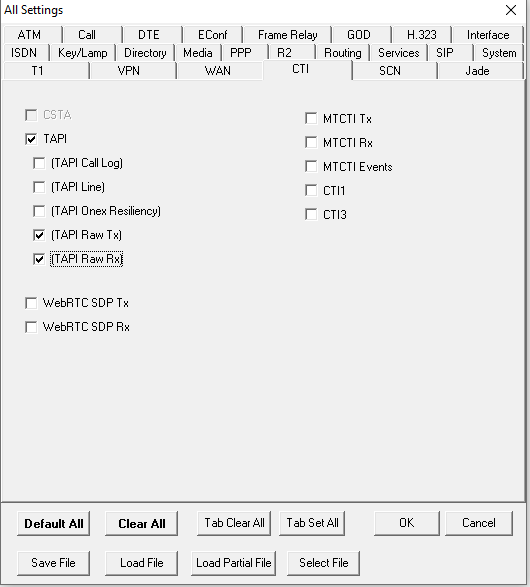
CTI tab:
- TAPI
- TAPI Raw RX
- TAPI Raw TX
- TAPI
-
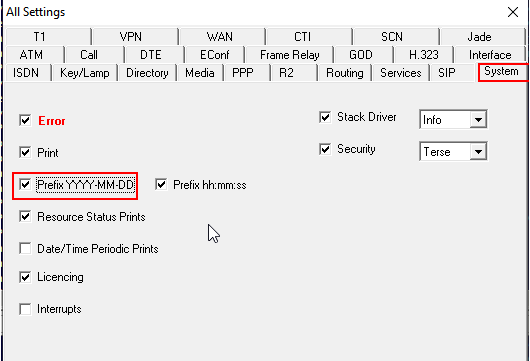
System tab:
-
Prefix YYYY-MM-DD
-
-
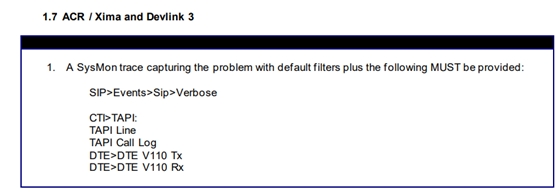
SIP > Events > Sip > Verbose:
-
CTI>TAPI
-
TAPI Line
-
TAPI Call Log
-
DTE>DTE V110 Tx
-
DTE>DTE V110 RX
-
-
-
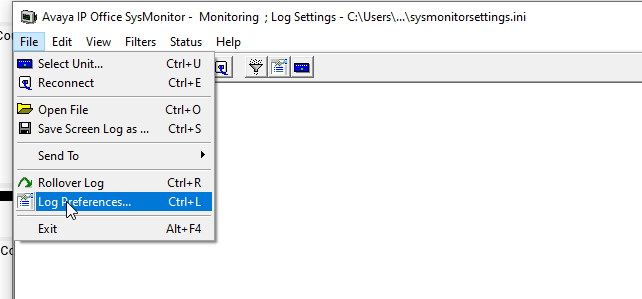
Once the filters are selected, run the Monitor Trace and save the log by selecting File > Log Preferences...
-
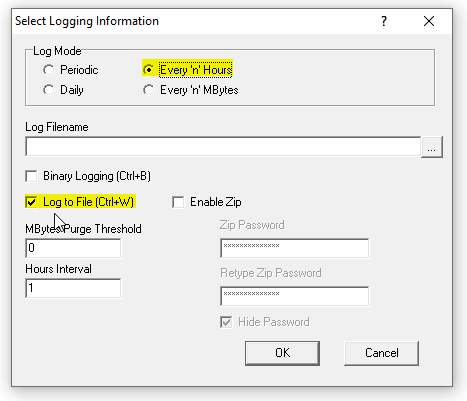
Next, select the following options:
-
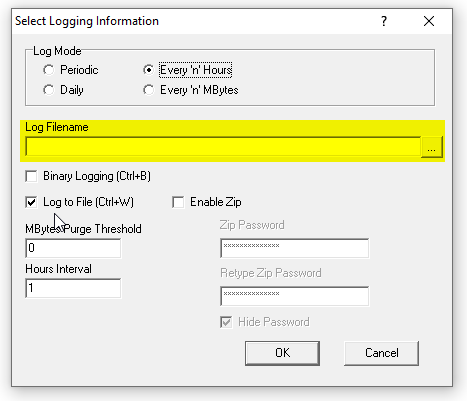
Under Log Filename, specify a path and file to save the log output:
-
Finally, gather the saved log file and attach it to the Xima Care ticket.
Updated 3 months ago