Building a Wallboard - Java
Realtime Wallboards allow you to see the activity of your groups and agents in Realtime, without a refresh rate. This is done by a series of widgets that you can customize to reflect your specific needs. The wallboards provide you the option to build your own wallboard from the ground up, or you can use a pre-built wallboard template provided to you upon accessing the wallboards. This requires Realtime licenses.
Building a Wallboard
Building your own wallboard can seem overwhelming, but is not super difficult. To build your wallboard:
- Select Realtime Displays on the Chronicall main menu
- Select Realtime Stats
If you have never accessed the wallboards, a window will appear displaying your wallboard template options.
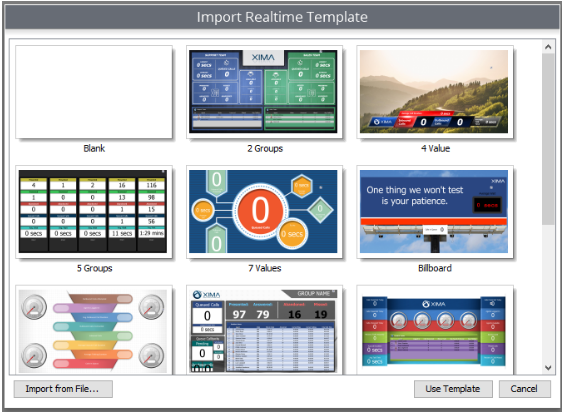
You can either start by Using Pre-built Wallboards, or you can build your own.
To build your own, start by selecting the "Blank" option.
This will open up a blank wallboard.
Adding a Background
When creating a wallboard, it is not necessary to build a background. However, you are welcome to be as creative as you'd like. If you prefer to have a background image in your wallboard, select the pencil tool in the top right-hand corner of the wallboard.
The wallboard parameters will appear.
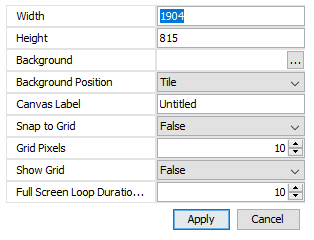
- The third line down says "Background." Select the ellipses tool to the far right.
- The file window will open, and you can select your desired image file.
- Hit "Apply" and your image will appear in the background.
Note: If the background image doesn't fit the screen, try adjusting it using the "Background Position" dropdown.
Wallboard Widgets
As you create your wallboard, you can let the creativity flow. You will have the ability to select your preference of widget from the list of Realtime Widgets listed at the top of the Chronicall window.

Once the desired widget is selected, you can either click on the screen and place it, or you can click and drag to the desired size of your widget.
The properties window will now appear, and you will now be able to select your desired value(s).
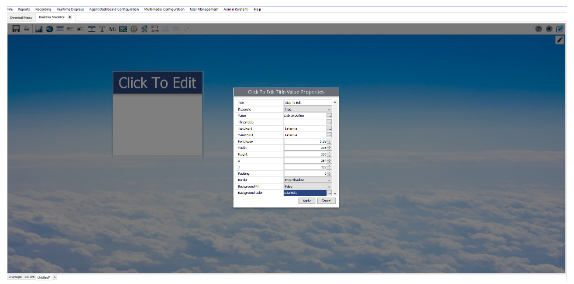
Click on ellipses next to "Value - Click to define," and your value options will appear.
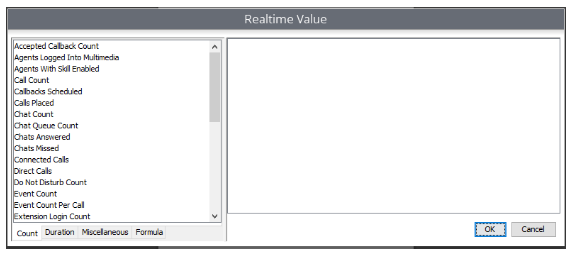
You will have four folders to choose from:
- Count (see Java Chronicall Realtime Metric Definitions)
- Duration (see Java Chronicall Realtime Metric Definitions)
- Miscellaneous (see Java Chronicall Realtime Metric Definitions)
- Formula
From this window, you can select the Realtime values that best fit your needs. Once you find the value under the list of options, select the value and the value parameters will appear on the right of the window.
- Answer the appropriate parameters, and hit "OK."
- Hit "Apply."
Example: Title Value Widget - Calls in Queue
Start by selecting the Title Value Widget

- In the properties window, select the ellipses tool next to "Value - Click to Define"
- The values window will now display.
- In the count folder, select the value option "Queued Calls"
- Once Queued Calls has been selected, to the right, there will be three parameters you will need to fill in.
- Time Frame
- Calculation
- Group/Queue
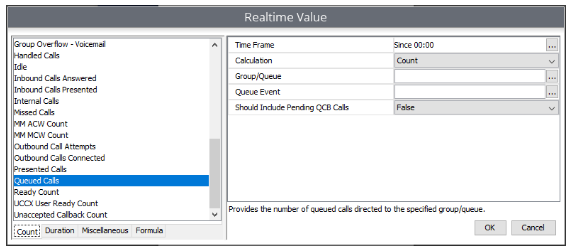
Time Frame: Time Frame allows you to select from three different options. I can select to see how many calls have been/are in queue:
Since - This will show how many calls have been in the queue since a specific time time of day. (Resets every twenty four hours)
Last - This will show how many calls have been in the queue in the last specified amount of time (e.g., two hours, thirty minutes, four hours and twenty seven minutes, etc.)
Now - This is a live event, meaning that it will display how many calls are in queue right now
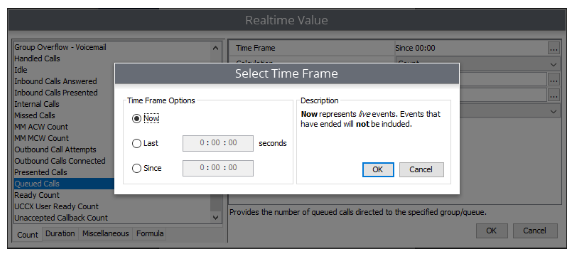
Select "Now" and hit "OK"
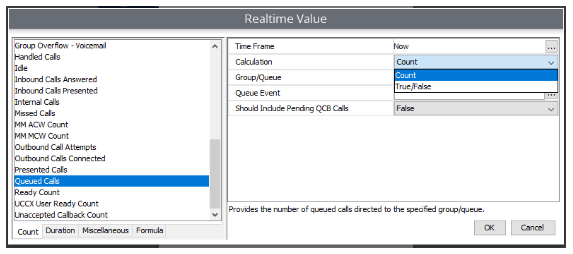
Calculation: The calculation option will vary based upon the value that is being used, the time frame in question, and upon the value folder (counts, durations, etc.).
For Queued Calls, you'll have two options:
- Count - Shows the actual number of calls in the queue
- True/False - True = Calls in Queue. False = No calls in Queue
For this scenario, select "Count," the hit "OK."
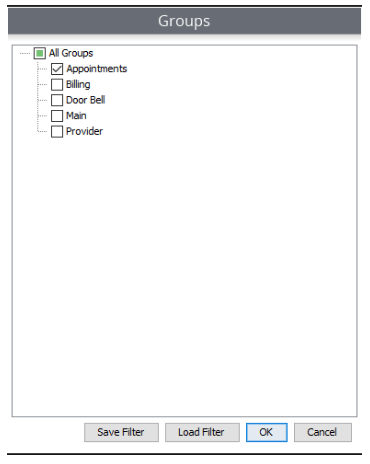
Group/Queue: This parameter is used to select the specific Hunt/Work groups you'd like to monitor. You can select one group which will show you calculations for that group only. You can also select multiple groups. This will give you a collective total.
For this scenario, select the desired Realtime groups that you would like to monitor, and hit "OK."
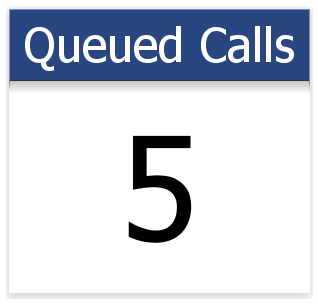
Once you've filled in those three parameters, you can hit "OK" again and that will take you back to the Properties window hit "Apply" and you'll have your widget.
Updated about 2 months ago